Treatment of childhood obesity by retraining eating behaviour: randomised controlled trial
BMJ 2010; 340 doi: https://doi.org/10.1136/bmj.b5388 (Published 06 January 2010) Cite this as: BMJ 2010;340:b5388
- Anna L Ford, research nurse1,
- Cecilia Bergh, CEO of Mando Group AB2,
- Per Södersten, professor2,
- Matthew A Sabin, RCH Foundation clinical research fellow14,
- Sandra Hollinghurst, senior lecturer3,
- Linda P Hunt, senior lecturer1,
- Julian P H Shield, professor 15
- 1Department of Clinical Sciences, South Bristol, University of Bristol
- 2Karolinska Institute, Section of Applied Neuroendocrinology, Mandometer Clinic, Novum, S-141 57 Huddinge, Sweden
- 3Department of Community Based Medicine, University of Bristol
- 4Murdoch Childrens Research Institute at the Royal Children’s Hospital, Melbourne, Australia
- 5Bristol Royal Hospital for Children, University Hospitals Bristol NHS Foundation Trust
- Correspondence to: J P H Shield, Bristol Royal Hospital for Children, Upper Maudlin Street, Bristol BS2 8AE j.p.h.shield{at}bristol.ac.uk
- Accepted 30 September 2009
Abstract
Objective To determine whether modifying eating behaviour with use of a feedback device facilitates weight loss in obese adolescents.
Design Randomised controlled trial with 12 month intervention.
Setting Hospital based obesity clinic.
Participants 106 newly referred obese young people aged 9-17.
Interventions A computerised device, Mandometer, providing real time feedback to participants during meals to slow down speed of eating and reduce total intake; standard lifestyle modification therapy.
Main outcome measures Change in body mass index (BMI) standard deviation score (SDS) over 12 months with assessment 18 months after the start of the intervention. Secondary outcomes were body fat SDS, metabolic status, quality of life evaluation, change in portion size, and eating speed.
Results Using the last available data on all participants (n=106), those in the Mandometer group had significantly lower mean BMI SDS at 12 months compared with standard care (baseline adjusted mean difference 0.24, 95% confidence interval 0.11 to 0.36). Similar results were obtained when analyses included only the 91 who attended per protocol (baseline adjusted mean difference 0.27, 0.14 to 0.41; P<0.001), with the difference maintained at 18 months (0.27, 0.11 to 0.43; P=0.001) (n=87). The mean meal size in the Mandometer group fell by 45 g (7 to 84 g). Mean body fat SDS adjusted for baseline levels was significantly lower at 12 months (0.24, 0.10 to 0.39; P=0.001). Those in the Mandometer group also had greater improvement in concentration of high density lipoprotein cholesterol (P=0.043).
Conclusions Retraining eating behaviour with a feedback device is a useful adjunct to standard lifestyle modification in treating obesity among adolescents.
Trial registration ClinicalTrials.gov NCT00407420.
Introduction
Childhood obesity is increasing almost universally with little evidence to support any specific treatment programme. A recent Cochrane review concluded that there was not enough evidence to recommend any specific weight management treatment programme over another but that combined behavioural therapy lifestyle interventions seemed to have an advantage over standard, self care dietary, or activity interventions.1
The Bristol Care of Childhood Obesity Clinic (COCO) was established in 1999 and uses simple dietary and activity based lifestyle modification to improve body composition in obese children and adolescents.2 The clinic has had some success in children, with improvement in body mass index standard deviation score (BMI SDS) (mean change in BMI SDS over 12 months −0.3),3 but adolescents have proved more difficult to positively influence than younger children. We carried out a randomised controlled trial with a novel eating device, the Mandometer, compared with the clinic’s standard care in young people aged 9-17.
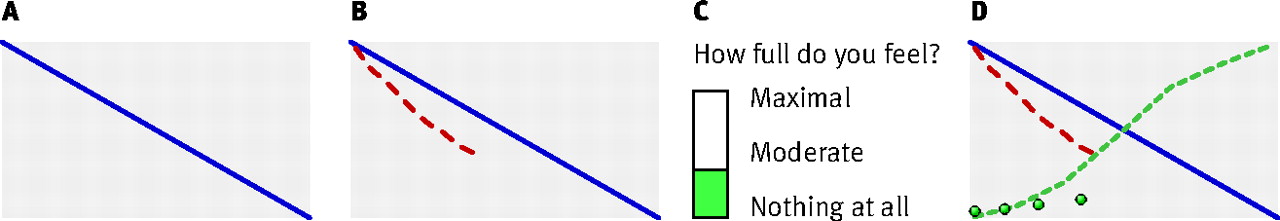
The Mandometer was developed at the Section of Applied Neuroendocrinology and Mandometer Clinic, Karolinska Institutet, Stockholm, Sweden. It is a portable weighing scale connected to a small computer that can generate a graph representing food removal from the plate, with weight of food (grams) on the y axis and time (minutes) on the x axis. The user puts a measured portion of food determined by a therapist on the scale and the computer records and displays, in real time graphics, the weight loss from the plate as the user eats: time zero on the graph effectively displays total portion size. Removing food from the plate generates a gradually developing line on a screen that can be compared and matched to a pre-set eating line displaying the speed at which the therapist wants the user to eat. Deviation from the training line by eating too quickly or slowly elicits a spoken request from the Mandometer to slow down or eat faster. At regular intervals, a rating scale appears on the screen and the user rates their level of fullness: from 0 (no satiety) to 100 (maximum satiety). That rating appears as a dot on the screen, yielding a “development of satiety” curve and allowing comparison of the development of fullness to a “normal” fullness curve again pre-set on screen. During training the user gradually adopts a more normal pattern of eating and satiety by following these training lines and curves (fig 1)⇓. A short video showing Mandometer training is available at www.someguys.se/clients/mandolean/mandometer_popup.html. These methods were developed for treating eating disorders such as anorexia and bulimia nervosa. A randomised controlled trial estimated a rate of remission of 75%.4

Fig 1 Representation of graphics seen on Mandometer screen during training. A—blue training line presented to user to follow while eating. B—red line develops as food is consumed. In this case, food is being consumed too quickly and the computer would encourage user to eat a little slower to approximate red line to training line. C—at regular intervals during meal, user is asked to rate satiety. D—satiety ratings (green circles) are plotted by computer on screen. User learns to associate feeling of “fullness” with green dashed S shaped satiety training line. When user is eating quickly, as in this case, satiety is rated low. Note: no numerical values are displayed on axes during training
In 1974 Schachter and Rodin suggested that obese people eat at an increased rate.5 Experimentally increasing the rate of food consumption can disassociate satiety from the amount of food ingested, potentially leading to overeating.6 7 An experimental increase in the speed of eating in normal weight volunteers caused overeating and delayed the development of satiety, thereby replicating the pattern of eating in a group of obese patients.8 Our pilot study showed that obese adolescents eat rapidly.9 Our participants used the Mandometer to try to reduce food intake and eating speed so we could determine whether this device might prove a useful adjunct in facilitating lifestyle modification.
Methods
Participants
The study was conducted at a children’s hospital in England. Eligibility criteria were age 9-<18 at recruitment, BMI >95th centile,10 minimal or no learning difficulties, no underlying medical problem such as hypothyroidism, and no medication for insulin resistance. Participants were recruited from new patients referred to the obesity clinic.
Randomisation
An independent statistician unconnected with clinical practice used computer generated random numbers (SAS Proc PLAN, SAS Institute, Cary, NC, USA) to prepare randomisation lists. The block randomisation was four (two on standard care, two on Mandometer) with stratification by sex, age (<12.6 or ≥12.6 and baseline BMI SDS (2.4-4.0 or >4.0). ALF enrolled the patients into the study once their eligibility had been established and assigned patients sequentially according to the generated lists.
Intervention
Those in the Mandometer group saw a research nurse, previously trained in Mandometer technology (Mikrodidakt AB, Lund, Sweden) at the Mandometer Clinic, Stockholm, Sweden, initially once a week for six weeks, every second week for a further six weeks, and once every sixth week thereafter. The research nurse telephoned the patients to offer support and encouragement every second week from week 12 onwards. Dietary advice was provided by a paediatric dietitian not involved with the standard clinic, based on the Food Standards Agency “eatwell plate” at www.eatwell.gov.uk. This educational tool can be used to improve diet by encouraging the consumption of starchy foods, fruit and vegetables, moderate amounts of milk, dairy products, fish and lean meat and small amounts of high fat and high sugar foods. Recommended portion sizes for fruit and vegetables are also provided. Participants were given four dietetic consultations over 12 months. A clinician met the participants every four months, emphasising the need to change eating habits and improve physical activity as advocated in the standard clinic.
Mandometer training
During week one, the participant and his or her family were trained in the use of Mandometer.
Step 1—Test meals on the Mandometer were undertaken to assess baseline food intake, rate of eating, and satiety. The test meals were conducted in a clinical investigations unit with food from the hospital canteen, and the patients were given complete freedom as to food choice and portion size.
Step 2—The participant’s eating behaviour was then compared with previously established normal eating patterns.4 Individualised training lines for portion size, eating speed (reflecting weight removal from plate on y axis), and satiety were then programmed on to the participant’s Mandometer.
Step 3—The participants were encouraged to eat their cooked meal (usually the evening meal) once a day from their Mandometer, matching as closely as possible their red eating line to the current pre-set “optimal” eating line. As our pilot study identified that eating meals at school had proved difficult for some participants for practical or personal (peer comments) reasons we advised that they used Mandometer with the evening meal. Participants had to eat their Mandometer meal at a table to ensure the scales performed normally.
Step 4— Participants received up to four new training lines during treatment, effectively reducing the total portion size (y axis, time 0) and slowing down weight removal from plate on the y axis (usually completed within six months of starting) to “normalise” portion size, eating rate, and satiety response. Treatment aimed to help the participant to feel “full” after eating 300-350 g of food over 12-15 minutes. Normal weight, healthy volunteers stop eating and rate their level of satiety at about 50-60 on the Mandometer rating scale after eating this amount of food in this period of time.4 There was no prescription for meal composition: individuals’ food choices were based on their understanding of healthy eating after nutritional education based on the eatwell plate.
Standard care
At the first contact about an hour was spent with each family discussing the reasons underlying childhood obesity, its implications, and possible lifestyle measures that might be associated with an improved BMI.
The clinic was run by a multidisciplinary team composed of a clinician, a paediatric dietitian, and an exercise specialist, all of whom consulted with each family. Emphasis was placed on implementing changes to increase levels of enjoyable physical activity to national recommended levels (60 minutes of exercise a day) alongside a balanced diet, again based on the eatwell plate. Families were encouraged to set their own dietary goals and targets, with practical advice and guidance from the dietitian. In encouraging activity the approach was one of facilitation rather than prescription. Motivational interviewing techniques were used to engage participants and families in the decision making process for lifestyle changes, which is consistent with self determination principles and is more likely to lead to responsibility for long term change.11 Families were given further clinic appointments at three monthly intervals.
Outcomes
Body weight (kilograms) was measured with SECA scales to one decimal point. Height was measured to the nearest 0.1 cm with a stadiometer. BMI was calculated as weight (kg)/height (m)2. Waist circumference was measured in centimetres to one decimal point with a standard anthropometric tape at the maximal circumference. BMI was adjusted for age and sex to give a BMI SDS with British 1990 growth reference data from the Child Growth Foundation.10
Our primary outcome was change in BMI SDS at the end of the intervention (12 months), with further follow-up at 18 months (six months after the end of treatment, with no contact between clinical staff and participant in that period).
We also had several secondary outcomes. We assessed change in percentage body fat/body fat SDS (Tanita Bioimpedence Monitor Model BC-418MA, Tanita, Tokyo, Japan). The model used has been validated against more complex investigations to assess adiposity12 13 and across the pubertal age range.14 Participants undertook blinded test meals for assessment of grams of food consumed, speed of eating, and the development of satiety in the Mandometer arm and in a subgroup of the standard arm for comparative purposes, recruited sequentially from midway through the study period. Blinding was achieved by not providing the individualised training lines for portion size and recommended eating speed, nor any visible feedback on the computer while the participants consumed their meal. The data on total food consumption in grams and speed of eating, however, was recorded on the Mandometer device for later analysis.
Fasting glucose and insulin concentrations, lipid profile, and high sensitivity C reactive protein (HsCRP) were measured in the early morning after an overnight fast from midnight at baseline and at 12 months. Insulin resistance was measured by the homeostasis model assessment (HOMA-R) equation: HOMA-R = fasting glucose (mmol/l) × fasting insulin (mIU/l)/22.5.15 We used the paediatric quality of life inventory 4.0 (PedsQL(4.0)16) to measure state of wellbeing or quality of life. Blood pressure was measured with the participant in a seated position in the right arm after a 10 minute rest by manual sphygmomanometry with a random zero sphygmomanometer.
An experienced endocrinologist pubertally staged17 participants at baseline and 12 months. For analysis over time we defined puberty both by initial category and by change in status during the 12 month study period as pubertal development is associated with physiological changes in insulin sensitivity.18
Sample size
Our power calculation was based on an anticipated difference in mean absolute fall of BMI SDS at 12 months. The mean (SD) fall in BMI SDS in a pilot study of seven adolescents in whom behavioural modification therapy had failed was 0.17 (SD 0.267).9 We anticipated that Mandometer should be able to double this fall in new patients, giving an improvement similar to that we achieve in prepubertal children (0.34). To yield 80% power of detecting this reference mean difference (0.34−0.17), and using a 5% level of significance, we needed 80 children to complete the study (40 in each arm). Recruitment was inflated to reflect withdrawal of participants, which was 26% in the standard clinic over one year.3
Statistical methods
For the primary outcome at 12 months we carried out two analyses, one for the intervention group and the control participants who participated in the whole 12 months study and the second for all participants who attended for follow-up measures, regardless of treatment completion, using the last available data for analysis. As the children who dropped out before 12 months had a slightly higher initial mean BMI SDS than the others (see below), we used analyses of covariance to adjust for baseline values in comparisons between 12 month means.19 We analysed secondary outcomes only for those who completed 12 months. Triglyceride concentrations, high sensitivity C reactive protein, and insulin resistance were positively skewed and required logarithmic transformation before analysis. We analysed 18 month data only for those completing the 12 month study.
Results
Recruitment occurred between September 2004 and May 2007. Figure 2⇓ shows a flow chart for participants in the trial. Outcome measures were collected at baseline and 12 months. Table 1 shows demographic and baseline characteristics⇓.

Fig 2 Passage of participants through trial who were analysed for primary outcome variable (BMI SDS).*Includes one child who had technically dropped out
Demographic and baseline characteristics of young people seen at obesity clinic. Figures are numbers (percentage) unless stated otherwise
Primary outcome BMI SDS
Of the 91 participants with a 12 month assessment, those in the Mandometer arm had significantly lower mean BMI SDS at 12 months (table 2 and figs 3 and 4).⇓ ⇓ ⇓ The baseline adjusted mean difference was 0.27, 95% confidence interval 0.14 to 0.41; P<0.001; table 3)⇓. Results were similar when we used all last available measurements for all patients in the study (baseline adjusted mean difference 0.24, 0.11 to 0.36; P<0.001) (tables 2 and 3).

Fig 3 Graphic representation of final and initial BMI SDS with Mandometer and standard care showing greater improvement in Mandometer group

Fig 4 Change in BMI over 12 months (per protocol) against age (top) and BMI at first assessment (bottom). Dashed and solid lines are Loess “smoothers” for standard and Mandometer groups, respectively
Analysis of BMI SDS at end of intervention (12 months) and at 18 months. Figures are means (SD) body mass index standard deviation score (BMI SDS) unless stated otherwise
Statistics for difference between Mandometer and standard care in adolescents referred to obesity clinic
This advantage remained at 18 months, six months after the end of the intervention: baseline adjusted mean difference 0.27, 0.11 to 0.43; P=0.001 (table 3).⇑ Repeated measures analysis of variance (not shown) verified that the group differences did not change significantly from 12 months to 18 months (P=0.78 for the group by time interaction).
Secondary outcomes
Tables 4 and 5 show the results for the secondary outcomes⇓ ⇓. Participants in the Mandometer group had significantly greater benefits for reduction in body fat SDS and percentage body fat at 12 months. Confidence intervals indicated that those in the Mandometer group had a significant reduction (45 g, 7 to 84 g; 14%) in participant determined portion size of test meals at 12 months compared with a non-significant reduction in those receiving standard care (14 g, −46 to 74 g) (6%). This reduction in portion size at 12 months was not associated with a significant change in perceived satiety at the end of the meal compared with levels at study entry −5.4 (−2.0 to 12.7), indicating that they felt as full having consumed less food. Six months after completing therapy, the mean portion size in the Mandometer group was still reduced by 31 g (−2 to 64 g) compared with baseline, although this did not quite reach significance (P=0.061).
Estimates of body fat at baseline and 12 months. Figures are means (SD or 95% confidence interval)
Change in eating behaviour at baseline and 12 months, with 18 month data for portion size. Figures are means (SD or 95% confidence interval) unless otherwise specified
At 18 months, participants’ perceived satiety levels at the end of the meal in the Mandometer arm, with a sustained reduction in BMI SDS, were similar to those at baseline and 12 months (table 5).⇑ Those in the Mandometer group reduced their speed of eating by 11% compared with a gain of 4% in the standard arm, but confidence intervals did not suggest that the reduction in the Mandometer arm was significant (table 5).⇑ High density lipoprotein cholesterol concentration improved significantly (mean adjusted difference −0.07, −0.14 to −0.00; P=0.043) compared with in the standard care group. We found no differences in low density lipoprotein cholesterol concentration, high sensitivity C reactive protein, insulin resistance, or blood pressure. Measures of quality of life improved in both arms during the study, with no significant difference at 12 months. No adverse events were reported.
Retraining period
The final training line was achieved at a median of 112 days (interquartile range 32-139). A mean of three changes were made to the training line made during therapy (range 1-7).
Compliance
Over the 12 months attendance at the scheduled clinic appointments was 66% in the standard arm (mean clinics attended 2.6 of 4) and 81% the Mandometer arm (mean 2.5 of 3) Participants in the Mandometer group kept 83% of a maximum 15 appointments with the training nurse in the 12 months.
Discussion
Main findings
Modifying eating behaviour might provide additional benefits to standard lifestyle modification in treating obese adolescents. While it is unknown whether a specific eating pattern is typical for all obese individuals,6 those in our pilot study ate large portions very fast,9 confirming recent findings in adults20 and children.21 22 Participants randomised to feedback therapy with a Mandometer achieved greater improvement in age and sex adjusted BMI and body fat SDS, having successfully altered portion size without compromising levels of satiety compared with those receiving the traditional behavioural modification approach used in our clinic.3 The weakening of the effect of reduced portion size six months after therapy suggests that intermittent short periods of retraining might be necessary to maintain maximum benefit. The Mandometer group also displayed a greater improvement in concentrations of high density lipoprotein cholesterol. The study was powered to observe effects on BMI SDS, with both arms receiving an active intervention as it was thought unethical to have a formal control group with no intervention. Variables such as insulin sensitivity, low density lipoprotein cholesterol concentration, and self esteem improved in both groups, concurrent with a reduction in BMI SDS in both arms. This probably contributed to a lack of further examples of improvement in metabolic variables in the comparisons between the groups.
Strengths and limitations of study
We could not blind participants, which might have led to increased dropout levels for the “non-intervention” arm. We were unable to determine an adequate method for blinding within the ethical constraints of conducting a trial in minors. Retention, however, was excellent and similar in both groups, and quality of life measures improved equally, suggesting that bias from drop out in the standard care arm was not an issue. Retention of 86% of participants at 12 months compares favourably with other behavioural trials in adolescents, which have reported 30%-47% dropout levels over a similar time frame.23 24 The difference in outcomes, to some extent, might reflect the higher intensity of contact that naturally occurred in the Mandometer group by virtue of the training requirements.
This was a pragmatic trial comparing our standard multi-component clinical service with that of Mandometer therapy. The uncertainty regarding contact time merits further evaluation as there is some evidence that treatment intensity might affect outcome in weight loss interventions.25 The participants in the standard arm in our study, however, maintained their improvement in BMI SDS six months after therapy, suggesting that standard care did have an impact, albeit less effective. A further issue might be that of different dietitians providing advice to the two arms to prevent cross contamination regarding the specific eating behaviours we were addressing. Both were instructed to deal solely with dietary issues based on the eatwell plate, but it is possible their individual approaches differed. One important issue we were unable to address was how many times each person in the Mandometer group actually used this device in the 12 months, although all were encouraged to use it on a daily basis. This would have provided extra data that might have identified whether regular sustained use was associated with a better outcome. With the current Mandometer device collection of these data is now possible.
Comparison with other studies
A one year mean change in BMI SDS of −0.4 for Mandometer therapy is encouraging as other studies in the United Kingdom have recorded much smaller changes over this period,26 27 and these results are an improvement on adiposity measure outcomes for those studies used in the recent Cochrane meta-analysis.23 24 28 Furthermore, the Cochrane meta-analysis in adolescents detected an advantage for behavioural interventions over standard or control care of BMI SDS −0.14 (−0.18 to −0.10). Again our study shows encouraging results as the mean difference between standard care and Mandometer therapy was −0.27, a difference maintained six months after the end of therapy.
A study with a somewhat similar intensity of management was the residential weight loss programme run in Leeds.29 Individuals stayed at the “camp” for an average of 29 days, with a mean reduction in BMI SDS of 0.28. The Mandometer, however, is provided at home and allows the family to observe the changes needed to positively affect weight, which might lead to more profound long term changes in lifestyle behaviours.
The mean change in absolute BMI of 2.1 for Mandometer participants is more than the 0.55 (no BMI SDS provided) achieved in a trial in adolescents using orlistat over a 12 month period,30 but similar to the results of a large trial using sibutramine, in which the mean improvement in BMI over 12 months was 2.9 with 17 points of contact between recruits and the trial team.31
Conclusions and implications
Mandometer therapy, focusing on eating speed and meal size, seems to be a useful addition to the rather sparse options available for treating adolescent obesity effectively without recourse to pharmacotherapy. We believe that the device addresses a particular aspect of the eating behaviour associated with obesity—namely, eating speed—inducing greater “satiety responsiveness” as shown by the reduction in portion size determined by the participants at the end of therapy, with similar levels of satiety to baseline. We did not use the Mandometer device as a stand alone approach but included education regarding nutrition and physical activity, although these aspects were provided equally to both arms of the study.
Though we explored the use of this device in adolescents, further studies are warranted in younger children and adults and as a weight maintenance device after interventions such as laparoscopic gastric banding surgery, when adjustment of speed of eating and portion size can be extremely important.32 The Mandometer requires further evaluation in other settings and with different groups of patients. From the data provided, short retraining periods might be needed to maximise benefit in the longer term. Retraining eating behaviour and reinforcing feelings of satiety, however, does seem to improve weight loss in obese adolescents. In broader terms, our study provides additional evidence that interventions specifically addressing eating behaviours might be useful in obesity therapy.
What is already known on this topic
Adolescent obesity is increasing in prevalence
Speed of eating has been linked to risk of obesity
Few if any interventions have sustained benefit in terms of body mass improvement
What this study adds
An intervention aimed at slowing down speed of eating and reducing portion size through retraining eating behaviour is a useful adjunctive therapy to standard lifestyle modification in obese adolescents
Interventions specifically addressing eating behaviours associated with obesity could become a valuable new tool in combating obesity
Notes
Cite this as: BMJ 2010;340:b5388
Footnotes
We thank the participants and their families for taking part in this study; David Hopkins, Shelly Easter, and Riyaz Jamal for their clinical contributions; and Stafford Lightman and Michael Leon for constructive discussions.
Contributors: JPHS, MAS, CB, PS, and LPH designed the study. ALF conducted the Mandometer intervention with advice from CB. LPH, ALF, SH, and JPHS managed the database and performed all of the trial statistical analysis presented here, independent from the Mandometer Clinic, Sweden. CB and PS developed the Mandometer in the Karolinska Institute, Sweden and during the pilot study of childhood obesity. All contributors reviewed and edited the manuscript. JPHS is guarantor.
Funding: This study was funded by the BUPA Foundation. The Mandometer devices were loaned to the research team at no cost.
Competing interests: CB and PS each have 28.35% stock in Mando Group AB. Mandometer AB, a fully owned subsidiary of Mando Group AB, holds the intellectual property rights to Mandometer. JPHS (on two occasions) and MS (one occasion) were funded by Mando Group AB for attending investigator meetings in Stockholm. AF stayed at the Mandometer Clinic for 11 weeks to be trained in the use of Mandometer and was funded by Mando Group AB.
Ethical approval: This study was approved by United Bristol Hospitals Trust research ethics committee (ref 04/Q2006/9) and written informed consent was given by all participating families.
Data sharing: No additional data available.
This is an open-access article distributed under the terms of the Creative Commons Attribution Non-commercial License, which permits use, distribution, and reproduction in any medium, provided the original work is properly cited, the use is non commercial and is otherwise in compliance with the license. See: http://creativecommons.org/licenses/by-nc/2.0/ and http://creativecommons.org/licenses/by-nc/2.0/legalcode.