Article Text

Abstract
Introduction In patients with type 2 diabetes mellitus (T2DM) with uncontrolled glycemia despite ongoing upward titration of basal insulin, targeting postprandial hyperglycemia may be required. Nevertheless, the point at which basal insulin is fully optimized and postprandial glucose (PPG) should be targeted with additional treatment remains unclear. We report here on the BeAM value (difference between bedtime and morning blood glucose values) as an indicator of the need to target PPG.
Methods This study had 3 stages: exploratory, main, and proof-of-concept analyses. For the exploratory and main analyses, data were pooled from phase 3 trials in adults with T2DM adding basal insulin to oral antidiabetic drugs (OADs). The main analysis included only patients who did not reach A1C ≤7.0% (53 mmol/mol) at week 24. The proof-of-concept analysis used pooled data from phase 3 trials in adults with T2DM adding insulin glargine and a single insulin glulisine injection to OADs.
Results In patients undergoing basal insulin titration, BeAM value increased over 24 weeks (27.8–61.7 mg/dL, n=1188; 32.6–71.2 mg/dL, n=553; exploratory and main analyses, respectively). There were significant correlations between week 24 BeAM value and postprandial contribution to hyperglycemia (Pearson's correlation coefficient (r)=0.375, p<0.001; r=0.396, p<0.001; exploratory and main analyses, respectively). When PPG was targeted (proof-of-concept analysis), the BeAM value reduced from 77.0 to 40.4 mg/dL (n=299).
Conclusions The BeAM value described in this study is a simple, easy-to-calculate value that may identify patients with T2DM using basal insulin that need targeting of postprandial control rather than advancing basal insulin dose.
- Insulin Treatment in Type 2 Diabetes
- Therapy Intervention
- Insulin Adjustment
- Postprandial Blood Glucose
This is an Open Access article distributed in accordance with the Creative Commons Attribution Non Commercial (CC BY-NC 4.0) license, which permits others to distribute, remix, adapt, build upon this work non-commercially, and license their derivative works on different terms, provided the original work is properly cited and the use is non-commercial. See: http://creativecommons.org/licenses/by-nc/4.0/
Statistics from Altmetric.com
- Insulin Treatment in Type 2 Diabetes
- Therapy Intervention
- Insulin Adjustment
- Postprandial Blood Glucose
Key messages
In patients with type 2 diabetes mellitus with uncontrolled glycemia despite optimally titrated basal insulin, targeting postprandial hyperglycemia may be required.
We report here on the BeAM value (difference between bedtime and morning blood glucose values) as an indicator of the need to target postprandial glucose.
The BeAM value described in this study is a simple, easy-to-calculate value that may identify patients with type 2 diabetes mellitus using basal insulin whose postprandial glucose needs targeting.
Introduction
Adequate glycemic control is associated with reduction in the risk of developing long-term complications of type 2 diabetes mellitus (T2DM); however, owing to the progressive nature of the disease, persistent treatment modifications are often required.1 When lifestyle modifications and treatment with oral antidiabetic drugs (OADs) fail to achieve normoglycemia, timely initiation of single-dose basal insulin treatment is a convenient, effective, and widely recommended strategy.1 Initiation of basal insulin has become an acceptable option more readily implemented by primary care providers.2 However, a common barrier to achieving glycemic goals is the inadequate titration of basal insulin dose. Several provider-driven or patient-driven algorithms have been established to promote easy upward titration of basal insulin doses, and most of them focus on achieving a specific fasting blood glucose (FBG) target.3 Even studies using forced titration algorithms fail to achieve the intended FBG targets, or do so at the expense of frequent nocturnal hypoglycemia.3 Despite basal insulin titration, A1C and FBG eventually reach a plateau,4–6 and primary providers may continue up-titration of basal insulin to reduce A1C and/or FBG levels, causing inadvertent overinsulinization. In a study using forced titration algorithms of basal insulin to five different FBG targets, a 20 U dose difference between the extreme groups resulted in only 0.25% difference in A1C,7 and a post hoc analysis of three insulin glargine trials also found that with titration beyond 0.5 U/kg, there was little fasting plasma glucose (FPG) reduction,8 and further consideration of whether continued up-titration of basal insulin alone with little evidence for further reductions in blood glucose measures is the best therapeutic approach.
The point at which basal insulin is fully optimized and postprandial glucose (PPG) should be targeted with additional treatment remains unclear. Current guidelines from the American Diabetes Association (ADA)/European Association for the Study of Diabetes (EASD) consensus position statement recommend considering the addition of mealtime insulin when FBG levels are on target or when basal insulin dose exceeds 0.5 U/kg/day.1 Monitoring PPG in patients with poor glycemic control has been used to identify the need for interventions targeting prandial excursions,9 ,10 but there is no consensus on the appropriate frequency and timing of self-monitoring of blood glucose (SMBG),11 and the absence of practical guidance to detect glycemic patterns based on SMBG limits the implementation of prandial SMBG in primary care.12 Despite an increased awareness of a strong association between postprandial or postchallenge hyperglycemia and cardiovascular risk,13–15 and in spite of direct recommendations from their providers, many patients do not routinely monitor PPG,16 and it is perceived as being inconvenient and disruptive of their daily routine.17
A simple and convenient, evidence-based and clinically relevant measure is needed to assist primary care providers in deciding when titration of basal insulin should cease in favor of targeting PPG excursions. We have examined a new marker of the need for intensification of therapy—the difference between bedtime and prebreakfast blood glucose values—which we have named the “BeAM value” (box 1), obtained by subtracting the morning SMBG (AM) value determined before breakfast from the previous night's bedtime SMBG (Be) value.
The BeAM value

We propose that bedtime (or 2 h postdinner) values, which are conveniently measured by patients at home, roughly reflect cumulative daytime postprandial excursions, and fasting or prebreakfast values, which are also conveniently measured at home, provide insights into possible basal insulin overutilization. As such, BeAM value may represent a more suitable and accurate indicator than total daily basal insulin dose or FBG alone of the need to address postprandial control in patients on combination OADs and undergoing optimization of basal insulin with FBG approaching target.
The aim of our study was to investigate the relationship between the BeAM value and A1C, FBG, and hypoglycemia events in patients undergoing basal insulin titration. Our study was conducted in three steps: an exploratory analysis, the main analysis, and a proof-of-concept analysis.
Research design and methods
Study population
For the exploratory study, data were pooled from prospective, phase 3 or 4 randomized controlled trials (RCTs) conducted in adults with T2DM who had insulin glargine or Neutral Protamine Hagedorn (NPH) insulin added to an existing OAD regimen. In these patients, basal insulin was actively titrated by protocol to achieve an FPG value ≤100 mg/dL; except for emergency reasons, no other prandial or bolus insulin was permitted. All patients who were randomized, treated, and had seven-point glucose measurements (including bedtime and prebreakfast measurements) were eligible. In total, 17 prospective RCTs evaluating the use of insulin glargine in adult patients with T2DM met the selection criteria. Of these 17 studies, 3 were rejected because they allowed insulin dose adjustments at the discretion of the investigator, 2 did not meet accepted good clinical practice standards, 5 did not have multiple-point glucose profiles, and 1 did not have blood glucose values collected at 2 h postdinner. The remaining 6 RCTs were used in this analysis (NCT00653341, NCT00783744, NCT00311818, NCT00701831).4 ,18–22 The overall group, as well as a subset of patients with a BeAM value ≥0 mg/dL at 24 weeks, was included in the week 24 analysis.
For the main analysis, a subset of data from the exploratory study were evaluated, including only the patients who did not achieve adequate glycemic control and had an A1C of >7.0% (>53 mmol/mol) at week 24, despite optimization of basal insulin dose. Only those with BeAM values ≥0 mg/dL at 24 weeks were included in the week 24 analysis.
For the proof-of-concept analysis, data were pooled from three prospective phase 3 RCTs conducted in adults with T2DM who had a single injection of mealtime insulin glulisine added to optimized insulin glargine and an existing OAD regimen (NCT00272012, NCT00135083, NCT00272064).23–25 In these studies, insulin glargine was titrated for ≥8 weeks with FPG targets of <110, ≤100, or <126 mg/dL, depending on the study design. To select only those who did not achieve adequate glycemic control following optimization of basal insulin, patients with A1C ≤7.0% (≤53 mmol/mol) after titration were excluded from the analysis, and baseline characteristics for the group were obtained. Patients received a single injection of insulin glulisine at the meal with the greatest glycemic impact (as a therapy intensification strategy), which was titrated to a 2 h PPG target of <140, ≤135, or preprandial glucose <110 mg/dL, depending on the study design. All patients who were randomized, treated, had bedtime (or postdinner) and prebreakfast measurements, and baseline (after basal optimization) BeAM ≥0 mg/dL were eligible for the analysis.
Study endpoints
Primary end points for all three analyses were BeAM values at baseline and week 24, and their relationship to A1C achievement. Baseline BeAM was defined as the difference between the mean baseline glucose value at bedtime and the mean baseline prebreakfast value; week 24 BeAM was the difference between the mean week 24 glucose value at bedtime and the mean week 24 prebreakfast value. The change in BeAM from baseline to week 24 was also calculated.
Secondary end points included the relationship between BeAM value and the relative contribution of postprandial hyperglycemia to hyperglycemic exposure (>100 mg/dL), and the proportions of patients with BeAM values <0, 0–50, and >50 mg/dL. The association between BeAM and hypoglycemia was also assessed. Hypoglycemic events were classified as symptomatic (any episode consistent with hypoglycemia was recorded whether or not a confirmatory SMBG was performed) and nocturnal (all symptomatic hypoglycemic events checked as “nocturnal” on the case report form, where “nocturnal” was defined by the individual study protocol).
Statistical analysis
To evaluate the contribution of postprandial hyperglycemia to hyperglycemic exposure, four areas were calculated geometrically from the seven-point glucose curve, as described previously.26 Normal glycemic exposure (area under the curve (AUC) N) was calculated as 100 mg/dL×24 h=2400 mg/dL/h of exposure; basal hyperglycemia (AUC B) is the area between 100 mg/dL and a line projected rightward for 24 h from the fasting (prebreakfast) glucose value in the profile. This area is taken to represent the daily abnormal glycemic exposure resulting from basal hyperglycemia. Postprandial hyperglycemia (AUC P) was calculated from the area above the line projected rightward from the fasting value and below the line connecting the six remaining points, minus any area below the line projected from the basal value, if applicable. This area is considered to reflect the postprandial glycemic responses to breakfast, lunch, and dinner. Total glucose (AUC G) was calculated from the total area under the glucose curve and is the sum of the other three areas (AUC G=AUC N+AUC B+AUC P). The relative contribution of postprandial blood glucose to the total blood glucose increment was calculated using the equation (AUC P/(AUC B+AUC P))×100%. Negative values were set to zero.
The relation between BeAM and the contribution of postprandial hyperglycemia to hyperglycemic exposure was assessed at baseline and at week 24 using Pearson’'s correlation coefficient.
The occurrence of hypoglycemic events (yes/no) was analyzed by a logistic model using BeAM category (<0, 0–50, and >50 mg/dL) and the individual source study name or number as categorical variables. The model included the source study to adjust for the possible effect carried over by the study design. Yearly rate of hypoglycemia was calculated by multiplying the total number of events by 365.25 and dividing it by the number of days that the patient was on treatment; the correlation between this and BeAM was assessed using Pearson's correlation coefficient.
Results
Patient demographics and characteristics
Exploratory analysis
The exploratory group included 1699 patients from the selected six RCTs, 1188 of whom had baseline and week 24 BeAM values available, and a week 24 BeAM value ≥0 mg/dL. The demographics and characteristics of these patients are listed in table 1.
Patient demographics and characteristics
Main analysis
The main analysis was performed on a subgroup of patients from the exploratory study who received insulin glargine or NPH insulin, did not achieve glycemic control after basal insulin optimization (had a week 24 A1C value >7.0% (>53 mmol/mol)), and had a positive BeAM value at week 24 (week 24 BeAM ≥0 mg/dL). A total of 553 patients did not achieve adequate A1C, and 492 of them had week 24 BeAM ≥0. The demographics and characteristics of these 492 patients are listed in table 1.
Proof-of-concept analysis
We selected three studies that had used a “basal plus” design (single prandial injection added to basal insulin) for the proof-of-concept analysis. Following optimization of insulin glargine, considered the baseline for this analysis, 331 patients received a single additional injection of insulin glulisine, and 299 of these patients had a BeAM value ≥0 mg/dL at baseline. The demographics and characteristics of these 299 patients are listed in table 1.
Changes in BeAM at week 24
Exploratory analysis
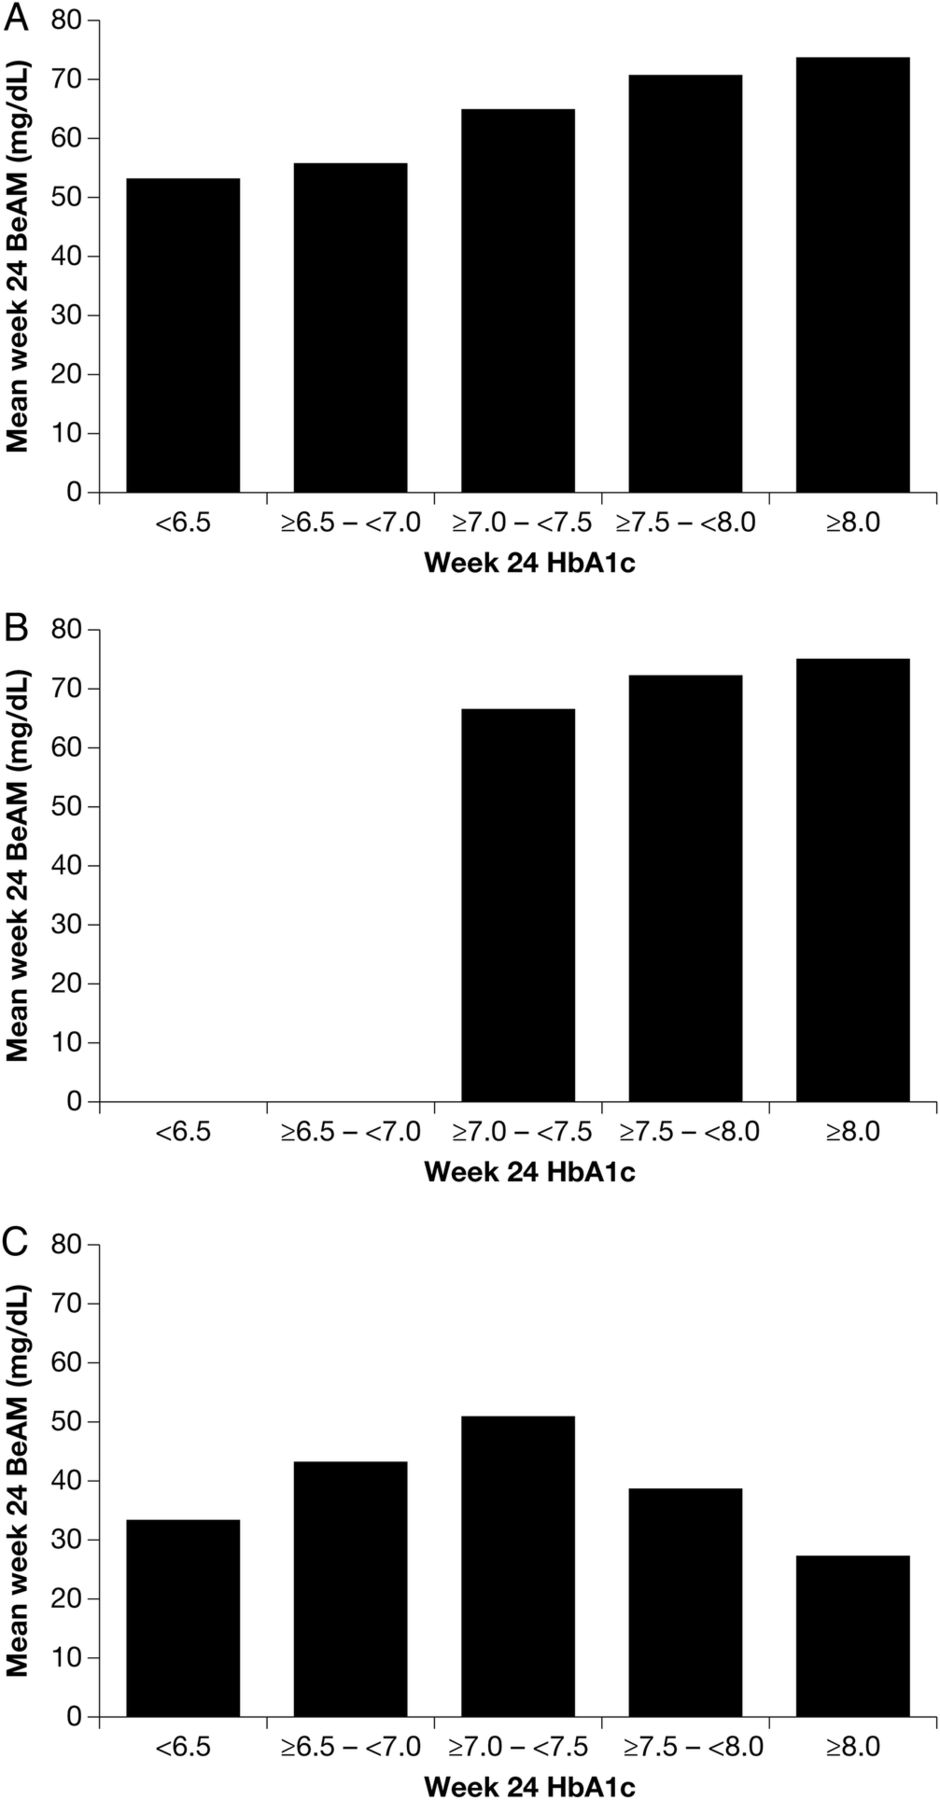
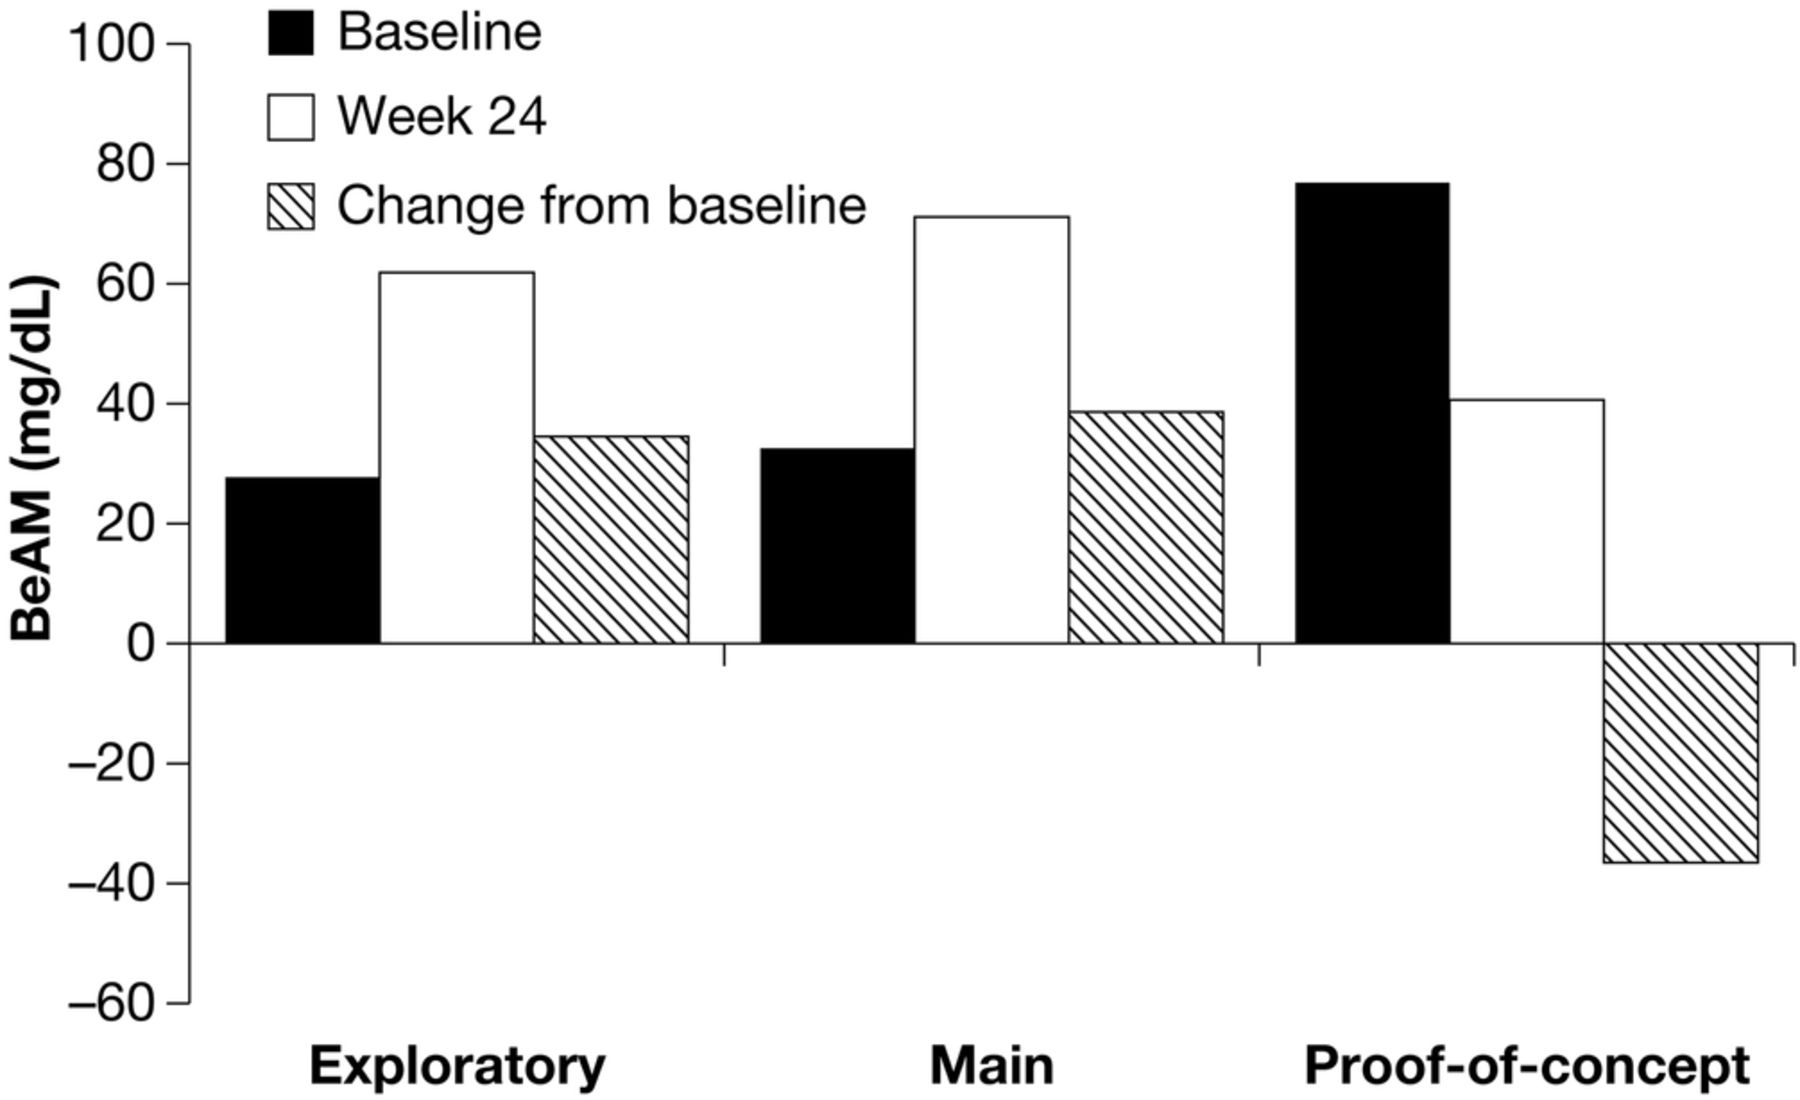
Of the 1401 patients with BeAM values, similar proportions had baseline BeAM values <0, 0–50, and >50 mg/dL (33.1%, 36.8%, and 30.0%, respectively). At week 24, 15.2% of patients had a BeAM value <0 mg/dL, 42.0% had a BeAM value 0–50 mg/dL, and 42.8% had a BeAM value >50 mg/dL. For those with BeAM ≥0 mg/dL at week 24 (n=1188), the mean (SD) BeAM value at baseline was 27.8 (58.1) mg/dL, rising to 61.7 (47.6) mg/dL at week 24. The mean (SD) change in BeAM value from baseline to week 24 was 34.0 (71.5) mg/dL (figure 1). There was a significant positive correlation between week 24 BeAM and week 24 A1C (Pearson's correlation coefficient (r)=0.171, p<0.001) (figure 2A).

Mean baseline, week 24, and change from baseline in BeAM value in the three analyses.
Relationship between week 24 A1C and week 24 BeAM in the exploratory analysis (A), the main analysis (only patients with A1C >7.0% at week 24 were included in the main analysis) (B), and the proof-of-concept analysis (C).
Main analysis
Of the 553 patients with a BeAM value, similar proportions had a baseline BeAM values <0, 0–50, and >50 mg/dL (30.7%, 35.6%, and 33.6%, respectively). At week 24, approximately half (50.5%) of the patients had a BeAM value >50 mg/dL, 11.0% had a BeAM value <0 mg/dL, and 38.5% had a BeAM value 0–50 mg/dL. For those with BeAM ≥0 mg/dL at week 24 (n=492), the mean (SD) BeAM value at baseline was 32.6 (61.2) mg/dL, rising to 71.2 (53.1) mg/dL at week 24. The mean (SD) change in BeAM value from baseline to week 24 was 38.6 (76.7) mg/dL (figure 1). There was a significant positive correlation between week 24 BeAM and week 24 A1C (r=0.107, p=0.018) (figure 2B).
Proof-of-concept analysis
At baseline, following optimization of insulin glargine, the majority of patients (57.1%) had a BeAM value >50 mg/dL. At week 24, almost a quarter of patients (21.4%) had a BeAM value <0 mg/dL, while similar proportions of patients had BeAM values 0–50 mg/dL (39.8%) and >50 mg/dL (38.8%). For those with BeAM ≥0 mg/dL (n=299), the mean (SD) BeAM value at baseline was 77.0 (51.3) mg/dL, falling to 40.4 (54.7) mg/dL at week 24. The mean (SD) change in BeAM was −36.5 (67.6) mg/dL (figure 1). There was no correlation between week 24 BeAM and week 24 A1C (r=−0.037) (figure 2C).
Contribution of postprandial hyperglycemia to hyperglycemic exposure, and relationship to BeAM value
Exploratory analysis
At baseline, the postprandial contribution to hyperglycemia was 22.5%, increasing to 71.6% following 24 weeks of treatment. At both baseline and week 24, statistically significant positive correlations were observed between BeAM value and postprandial contribution to hyperglycemia (r=0.632 and r=0.375, respectively; both p<0.001).
Main analysis
In the main analysis, the postprandial contribution to hyperglycemia was 23.5% at baseline, increasing to 69.3% following 24 weeks of insulin treatment. As in the exploratory analysis, statistically significant positive correlations were observed between BeAM value and postprandial contribution to hyperglycemia at both baseline and week 24 (r=0.668 and r=0.396, respectively; both p<0.001).
Proof-of-concept analysis
Only one of the three studies selected for the proof-of-concept analysis23 had the appropriate seven-point glucose profile required to calculate postprandial contributions to hyperglycemia exposure. In this study, at baseline, the postprandial contribution to hyperglycemia was 79.8%; this decreased to 64.2% at week 24. Statistically significant correlations were observed between BeAM value and postprandial contribution at both baseline and week 24 (r=0.471 and r=0.487, respectively; both p<0.001).
Relationship between BeAM value and hypoglycemia
Exploratory analysis
There was no association between baseline BeAM category and the frequency of either symptomatic or nocturnal hypoglycemia (table 2). There was no association of BeAM category at week 24 and the frequency of symptomatic hypoglycemia; however, the BeAM category at week 24 was significantly associated with the frequency of nocturnal hypoglycemia, with greater frequency of nocturnal hypoglycemia in patients with week 24 BeAM >50 mg/dL (table 2). There were weak, yet statistically significant positive correlations between week 24 BeAM values and yearly event rates of symptomatic hypoglycemia (r=0.094, p=0.001) and nocturnal hypoglycemia (r=0.1434, p<0.001).
Frequency of hypoglycemia by BeAM category
Main analysis
In the main analysis, there was no association between the frequency of either symptomatic or nocturnal hypoglycemia and BeAM category at baseline (table 2). However, the frequencies of both symptomatic and nocturnal hypoglycemia were significantly associated with BeAM category, with greater frequency in patients with week 24 BeAM >50 mg/dL (table 2). Weak, yet statistically significant positive correlations were observed between week 24 BeAM values and yearly event rates of symptomatic hypoglycemia (r=0.140, p=0.002) and nocturnal hypoglycemia (r=0.172, p<0.001).
Proof-of-concept analysis
In the proof-of-concept analysis, there was a significant association between the frequency of symptomatic or nocturnal hypoglycemia and BeAM category at study baseline, corresponding to basal insulin optimization, and therefore in keeping with findings in week 24 for the exploratory and main analyses above, with the frequencies of both increasing with increasing BeAM category (table 2). The frequency of symptomatic hypoglycemia was significantly associated with BeAM category at week 24, but that of nocturnal hypoglycemia was not (table 2). No statistically significant correlation was observed between week 24 BeAM value and the yearly event rate of either type of hypoglycemia.
Discussion
The BeAM value described in this study has been designed to help clinicians identify patients on basal insulin who need treatment intensification. Large positive BeAM values in patients receiving basal insulin with FPG at goal may indicate poor control of PPG; it is these patients for whom pursuing control of PPG excursions may be most beneficial. The calculation of the BeAM value only requires prebreakfast and bedtime SMBG time points, which correspond to the times when patients typically take their medications. For this reason, BeAM can be conveniently measured by patients at home. Although a postmeal SMBG reading will also indicate the degree of PPG excursion, the BeAM value can measure the cumulative PPG for that day.
There were three stages to this study to investigate the validity of the BeAM value as an indicator for intensifying therapy for patients receiving basal insulin who have not achieved glycemic control. The first stage of this study, the exploratory analysis, in patients with T2DM who were undergoing targeted basal insulin titration showed a doubling of the BeAM value after 24 weeks of treatment. There was a link between uncontrolled hyperglycemia and large BeAM values, and the contribution of PPG to hyperglycemia was positively correlated with the BeAM value.
The second stage, and the main analysis for this study, was conducted in patients with A1C >7.0% (>53 mmol/mol) by week 24 and, as such, were more likely to require targeting of PPG. This study showed that BeAM values in these patients more than doubled, and approximately half of patients had a BeAM value >50 mg/dL by week 24. The large BeAM value in these patients suggests that basal insulin had been optimized, yet targeting of PPG excursions is required. In these patients, there is no further benefit to achievement of A1C control by titrating basal insulin, but rather the target for therapy should be shifted to PPG. This is confirmed by the contribution of PPG to hyperglycemia shifting from 24% to almost 70% over 24 weeks, illustrating the utility of the BeAM value in identifying where postprandial excursions are driving patient hyperglycemia.
The final part of this study was the proof-of-concept analysis. This analysis was conducted on patients who, at baseline, had been optimized on basal insulin glargine but still had A1C >7.0% (>53 mmol/mol), and then received 24 weeks of treatment with a single prandial injection of insulin glulisine. The results from this analysis show that when targeting prandial glucose excursions and increasing the degree of PPG control, patients’ BeAM values fall, further confirming the utility of the BeAM value to indicate the need to target PPG excursions. However, in a subset of patients, A1C remained >7.0% (>53 mmol/mol) in spite of a lower BeAM value; in these patients, factors in addition to postprandial hyperglycemia may need to be addressed to achieve A1C targets. Such patient factors include missing basal insulin dosing at night, eating after the bedtime insulin injection without coverage, or relative minor postdinner glucose excursions compared with other meals of the day.
Treatment intensification in patients with T2DM has been suggested to be initiated if the dosage of basal insulin has been progressively increased without a reduction in A1C or when FPG target is met, particularly in patients with inadequate glycemic control and frequent hypoglycemia.27 The BeAM value adds another individualized measure to aid clinicians in deciding if the time is right for additional intervention. Our retrospective analysis of data suggests that BeAM values in the range between 45 and 55 mg/dL should trigger the consideration of additional intervention. However, prospective studies will be required to validate this suggestion. A negative BeAM value will require additional investigation by the clinician while upward titration of basal insulin is halted. For example, a negative value may indicate glucose rebound after nocturnal hypoglycemia, an inefficient dosing technique, or perhaps another element of the patients’ lifestyle.
The consistent but weak correlation between large BeAM values and a higher incidence of hypoglycemia, particularly nocturnal, found in this study further indicate that a prandial strategy may be more appropriate than additional upward titration of basal insulin. Several therapeutic options are currently available for targeting postprandial hyperglycemia, such as rapid-acting insulins, glucagon-like peptide-1 receptor agonists, dipeptidyl peptidase-4 inhibitors, and sodium–glucose cotransporter-2 inhibitors.1 When choosing the type of prandial intervention, the clinician should balance the potential benefits with the added risks of hypoglycemia created by the new intervention, take into account individual patient needs, including patient's degree of hyperglycemia (in particular if this is affecting any comorbid conditions), and their willingness to potentially accept multiple daily injections.27
Conclusions
Despite the well-documented progressive nature of T2DM and the clinical consequences of elevated PPG, there is currently no clear definition of the point at which a basal insulin regimen may be considered optimized and prandial insulin should be added.27 Our analyses suggest that use of the BeAM value could provide a simple, easy-to-calculate indicator of the need for treatment intensification targeting prandial glucose excursions in patients who have not reached treatment goals on basal insulin.
As our data are retrospective, prospective studies are required to validate this promising addition to the clinical decision-making tools available to physicians treating patients with T2DM.
Acknowledgments
The authors received writing/editorial support in the preparation of this article provided by Nicola Truss, PhD, and Ewen Legg, PhD, of Excerpta Medica, funded by Sanofi US, Inc.
References
Footnotes
AS was at Sanofi US, Inc. at the time this study was conducted.
Contributors AZ developed the concept, interpreted the analyses, and drafted the manuscript. FM and AV developed the concept, assisted in interpreting the analyses, and reviewed/edited the manuscript. JS and RZ researched and analyzed the data, assisted in interpreting the analyses, and reviewed/edited the manuscript. AS assisted in interpreting the analyses and reviewed/edited the manuscript. All authors provided final approval of the manuscript for publication and are accountable for the accuracy and integrity of the work.
Funding This work was supported by Sanofi US, Inc.
Competing interests AZ has received speaker's honoraria from Sanofi US, Inc., Eli Lilly/Amylin, and Bristol-Myers Squibb/AstraZeneca. FM and AV are employees at Sanofi US, Inc. JS is an employee at Sanofi, Canada. AS was an employee of Sanofi US, Inc. at the time this work was conducted. RZ is an employee at Medpace and is under contract with Sanofi US, Inc.
Provenance and peer review Not commissioned; externally peer reviewed.
Data sharing statement No additional data are available.