Article Text

Abstract
Objective To assess effectiveness and implementability of the public health programme Life! Taking action on diabetes in Australian people at risk of developing type 2 diabetes.
Research design and methods Melbourne Diabetes Prevention Study (MDPS) was a unique study assessing effectiveness of Life! that used a randomized controlled trial design. Intervention participants with AUSDRISK score ≥15 received 1 individual and 5 structured 90 min group sessions. Controls received usual care. Outcome measures were obtained for all participants at baseline and 12 months and, additionally, for intervention participants at 3 months. Per protocol set (PPS) and intention to treat (ITT) analyses were performed.
Results PPS analyses were considered more informative from our study. In PPS analyses, intervention participants significantly improved in weight (−1.13 kg, p=0.016), waist circumference (−1.35 cm, p=0.044), systolic (−5.2 mm Hg, p=0.028) and diastolic blood pressure (−3.2 mm Hg, p=0.030) compared with controls. Based on observed weight change, estimated risk of developing diabetes reduced by 9.6% in the intervention and increased by 3.3% in control participants. Absolute 5-year cardiovascular disease (CVD) risk reduced significantly for intervention participants by 0.97 percentage points from 9.35% (10.4% relative risk reduction). In control participants, the risk increased by 0.11 percentage points (1.3% relative risk increase). The net effect for the change in CVD risk was −1.08 percentage points of absolute risk (p=0.013).
Conclusions MDPS effectively reduced the risk of diabetes and CVD, but the intervention effect on weight and waist reduction was modest due to the challenges in recruiting high-risk individuals and the abbreviated intervention.
- Type 2 Diabetes
- Cardiovascular Prevention
- Intervention
- Public Health
This is an Open Access article distributed in accordance with the Creative Commons Attribution Non Commercial (CC BY-NC 4.0) license, which permits others to distribute, remix, adapt, build upon this work non-commercially, and license their derivative works on different terms, provided the original work is properly cited and the use is non-commercial. See: http://creativecommons.org/licenses/by-nc/4.0/
Statistics from Altmetric.com
Key messages
Questionnaires are an inexpensive and rapid way to screen for people at risk of diabetes and to raise awareness of an individual's risk.
The threshold criterion used for an Australian questionnaire, AUSDRISK, resulted in recruitment of participants at very low risk of progression to diabetes or cardiovascular disease.
For entry to diabetes prevention programmes, the use of questionnaires should be combined with measurement of impaired fasting glucose, impaired glucose tolerance, or glycosylated hemoglobin.
Research questions
Knowledge about cost-effectiveness of interventions to prevent progression to diabetes is limited. What should be the questionnaire cut-off points for screening by clinical tests for entry to interventions that would give best value for money?
How can implementation in the real world be improved to maintain the effects of interventions observed under trial conditions?
How could quality improvement techniques be used to improve the effectiveness of diabetes prevention interventions in the real world?
Recent assessments indicate that 8.3% of adults worldwide (382 million people) have diabetes, and total numbers are projected to exceed 592 million within 25 years.1 Effective prevention is critical to reduce this looming burden of disease. In the randomized controlled setting, efficacy has been shown for lifestyle interventions, with progression to type 2 diabetes mellitus (T2DM) reduced by up to 58%,2–4 and with beneficial effects evident at 13 years follow-up.5 Guidelines have been produced and a systematic review has identified 22 small-scale, real-world translational diabetes prevention programmes.6–8 Little is known about their cost-effectiveness or their impact on cardiovascular disease (CVD), the main cause of morbidity and mortality in diabetes.6 Only two scaled-up programmes have been reported to date: FIN D2D9 and Life! Taking action on diabetes (Life!).10
Life! is a statewide, group-based, lifestyle modification programme, targeting people at high risk of developing T2DM in Victoria, Australia.10 Funded by the Victorian Government Department of Health and coordinated by Diabetes Australia—Victoria, it was modified in 2012 to Life! Helping you prevent diabetes, heart disease and stroke, with revised inclusion criteria and further programme development to specifically include CVD prevention (see online supplementary file 1). Approximately 25 000 people have participated in the Life! programme since 2007. The five programme goals, targeting improved diet and physical activity, are from the Finnish Diabetes Prevention Study (FIN DPS).4 The system design is drawn from the Good Ageing in Lahti (GOAL) implementation trial,11 and is a scaled-up version of the Greater Green Triangle Diabetes Prevention Project (GGT DPP), an Australian Government-funded national demonstrator project.12 During 2009–2014 the Melbourne Diabetes Prevention Study (MDPS) evaluated the effectiveness of the Life! programme. The objective was to learn from its results in order to further improve the programme and to describe the challenges of real-world diabetes prevention. Using a randomized controlled trial (RCT) for evaluation of a scaled-up, real-world diabetes prevention programme is unique.
Efficacy studies emphasize internal validity and ask ‘Can it work?’, excluding real-world factors, so the intervention alone is measured. Effectiveness studies ask ‘Does it work?’ in the real world, thus providing some indication of external validity and generalizability.13–15 Scaling-up refers to widespread adoption of interventions among real-world populations that retain or improve their effectiveness, affordability, and sustainability. Because of external, real-world factors, policies based on apparently sound evidence from RCTs may lead to implementation strategies that can encounter practical problems when scaled-up within complex health systems.16
The challenge now is to translate the positive outcomes from efficacy trials into effective real-world diabetes prevention programmes. Since there is little experience in how to translate such programmes, we also drew on emerging methodologies, like the Dynamic Sustainability Framework (DSF), which provided a guide for implementation.17 We apply the concepts of programme drift and voltage drop from the DSF when reporting the results of the MDPS to categorize the lessons from scaling-up to a statewide programme for which sustainability is also relevant. Our aim is that other countries can learn from our experience when they implement their own large-scale programmes.
Research design and methods
The trial protocol, outlined briefly below, has been published elsewhere.18
Study design
MDPS was a unique prospective parallel group RCT to assess the effectiveness of the Life! programme implemented in Victoria, Australia, for people 50–75 years old at risk of developing T2DM (note the Life! inclusion criteria, including age, evolved over the period of the RCT). Over 8 months, intervention participants received a diabetes prevention programme and controls received usual care from their general practitioners (GPs). Online supplementary file 2 shows the CONSORT diagram.
Recruitment
Eastern Melbourne metropolitan participants were recruited from general practices, accredited Life! provider organizations, pharmacies, community organizations, and events. To maximize recruitment and retention, multiple modes of participant contact were collected and used to engage participants. Developing a social connection with participants was important. The same nurse was responsible for all participant contacts and testing during the study.
Eligibility
Individuals scoring ≥15 on AUSDRISK aged 50–75 years were eligible.19 A score of 15–19 represents a one-in-seven risk of developing diabetes in 5 years, and scores of ≥20 a one-in-three risk. Exclusion criteria were: existing diabetes, laboratory evidence of existing T2DM defined as having a 2 h oral glucose tolerance test (OGTT) result of ≥11.1 mmol/L and/or a fasting plasma glucose (FPG) ≥7 mmol/L, severe mental illness, substance abuse, myocardial infarction within previous 3 months, pregnancy, difficulty with English, and other household members already involved in the study.
Randomization
Randomization occurred after eligibility was confirmed at baseline testing, described below. Individuals who were found to already have T2DM at baseline were excluded (FPG ≥7 mmol/L and/or 2 h glucose ≥11.1 mmol/L on OGTT). Randomization occurred using a sealed-envelope system, containing randomizations sourced from a random number table allocating participants to study arms in a 1:1 ratio.
Intervention
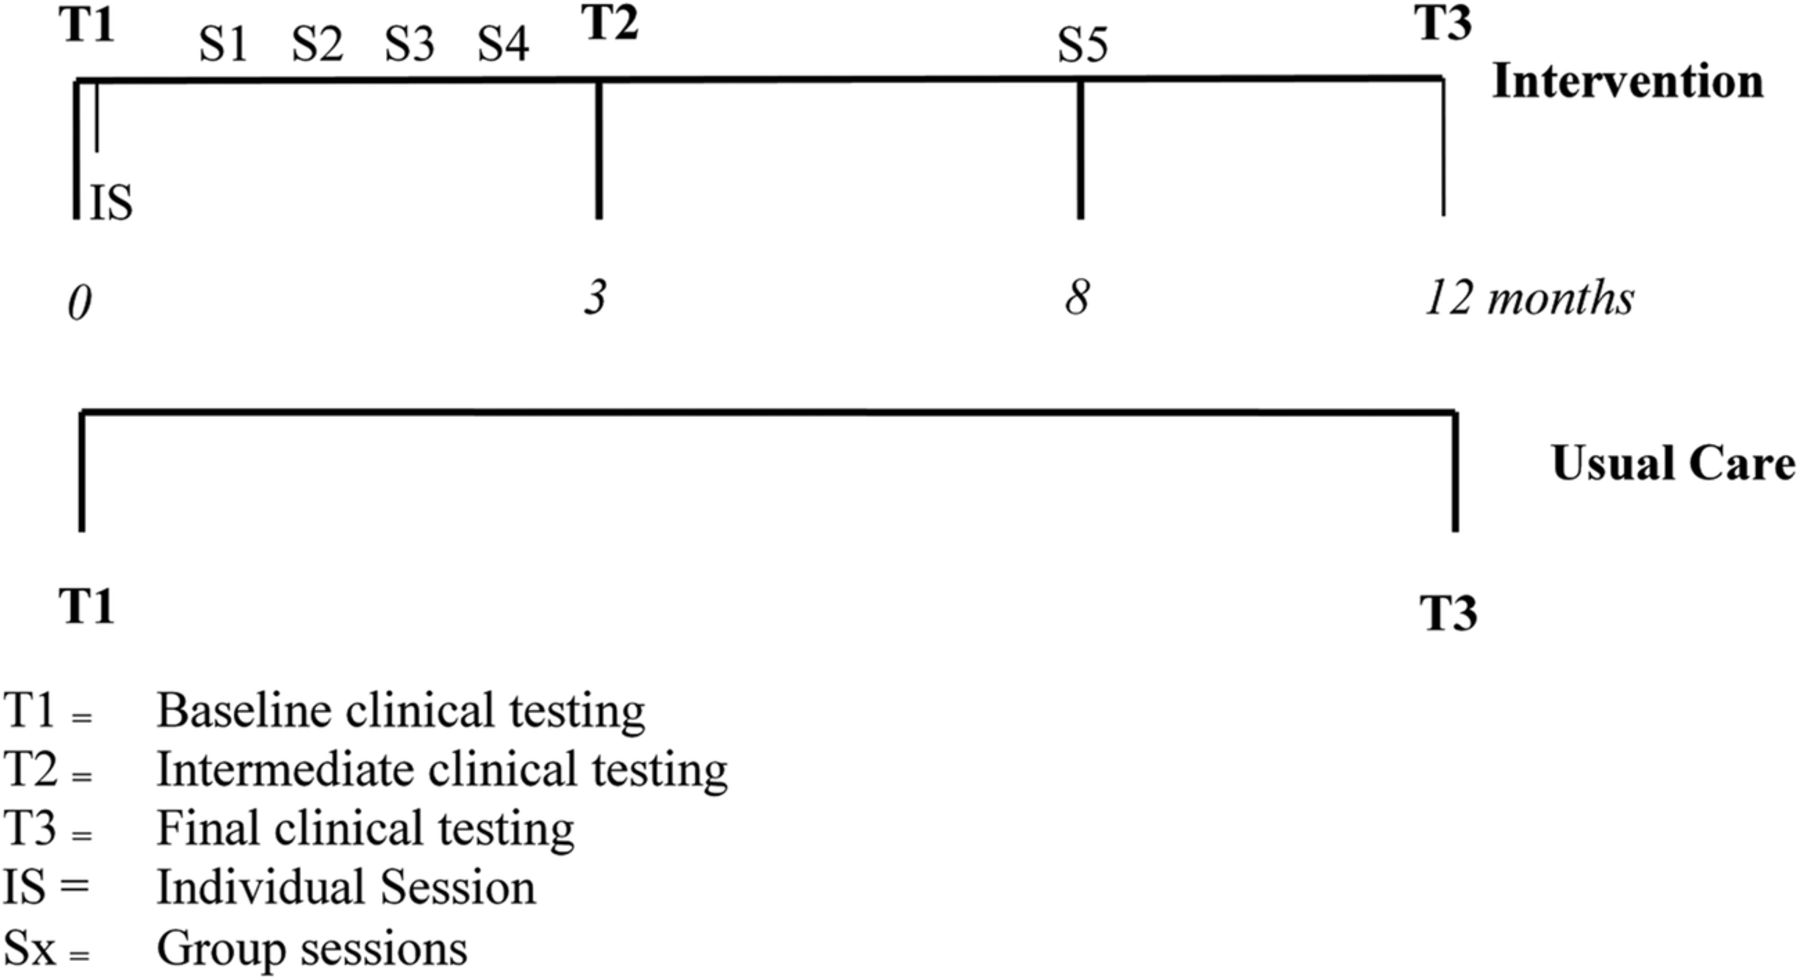
The intervention consisted of an initial 30–45 min individual session followed by five structured 90 min group sessions. The goals were: ≤30% energy from fat; ≤10% energy from saturated fat; ≥15 g/1000 kcal fiber; ≥30 min/day moderate-intensity physical activity; and ≥5% body weight reduction.4 Lifestyle change processes and detailed goals were individually tailored using problem-solving and goal-setting approaches. Trained MDPS facilitators (backgrounds in psychology, nutrition/dietetics and nursing) delivered all intervention sessions. The individual session was designed to maximize participant retention, increase personal risk awareness, undertake goal setting, and motivate change. Four group sessions followed at two-week intervals (generally 8–15 participants per group) and the final fifth session occurred 8 months after the initial group session (figure 1). Control participants were told of their high risk but continued with usual care from their GPs.
Structure of the Melbourne Diabetes Prevention Study (MDPS).
The intervention followed the Health Action Process Approach framework.20–22 Facilitators moderated discussions on problem solving and goal setting, provided feedback, and strengthened the groups’ social support role. Feedback on participant outcome measures was provided after testing at 3 months (see below) and was used to highlight intervention impact and sustain participants’ motivation for lifestyle change.
Anthropometric measurements and laboratory testing
Anthropometric measurements followed international recommendations: WHO's Multinational MONItoring of Trends and Determinants in CArdiovascular Disease (MONICA) protocol and current European Health Risk Monitoring project.23 ,24 Both groups underwent anthropometric and laboratory tests at baseline (T1) and 12 months (T3; weight, waist circumference, blood pressure (BP), fasting triglycerides, total cholesterol, low-density lipoprotein (LDL) cholesterol, high-density lipoprotein (HDL) cholesterol, FPG, 2 h OGTT glucose, glycated hemoglobin). Intervention participants additionally underwent these tests, except OGTT, at 3 months (T2; figure 1). All anthropometric measurements were performed by trained nurses using the same equipment at all time points. Laboratory analyses were performed by Melbourne Pathology (NATA accredited with CDC traceable standardization). Participants self-reported dietary intake at T1 and T3 (Food Frequency Questionnaire, FFQ),25 and physical activity at T1, T2 and T3 (Active Australia questionnaire).26
Outcome assessments
Primary outcomes were estimated changes in risk of progression to diabetes and CVD determined from changes in weight, waist circumference, FPG, 2 h glucose on the OGTT, BP, and lipids. Predicted reduction in diabetes risk was estimated from the effects of weight reduction in the lifestyle arm of the US Diabetes Prevention Program, where risk reduced by 10% for each percentage point of weight loss at 6 months.27 There is evidence that the relationship is linear9 ,28 ,29 and that even modest weight reduction can reduce the risk of developing diabetes.30 An ongoing association between initial weight loss and reduced diabetes risk is supported by several clinical trials.27 ,31 ,32
CVD risk was calculated for participants without pre-existing CVD at recruitment using a modified Framingham risk equation including age, total serum cholesterol, HDL-cholesterol, sex, systolic BP, smoking status, and diabetes status (all participants non-diabetic at baseline).33
Sample size and power calculation
The power calculation was based on our previous study,12 and provided sufficient power to assess the effect on weight, waist circumference, FPG, HDL-cholesterol, and diastolic BP. The RCT was designed to detect a 0.23 effect size on diastolic BP with 80% power and 5% significance level. Diastolic BP as an outcome measure was predicted to need the largest sample size, requiring 398 participants in each arm, allowing for 25% attrition.18 Owing to slow accrual of participants, combined with MDPS fixed-term funding, 342 were ultimately randomized into the study—177 intervention and 165 control. The revised effect size for diastolic BP that could be detected with a two-sided, two-sample t test at the 5% significance level and 80% power was 0.30.
Data analysis
Analyses of primary end points were performed using SPSS V.20 and independently verified in GenStat Release V.16.1. Participants’ baseline characteristics are presented as summary measures. Analyses were carried out for all participants randomized to the study (intention to treat (ITT) set) and for the per protocol set (PPS), sometimes referred to as the modified ITT analysis set; the subset of participants in the full analysis set without major protocol deviations. Such protocol deviations were determined independently of and prior to the unblinding of the trial statistician. These included postbaseline assessments beyond the specified time window (n=2); randomized to control group but attended a Life! group or randomized to intervention and household member attended a Life! group (n=2); medical conditions potentially causing large weight loss or gain (colon resection, recent mastectomy, removal of skin flaps) (n=3); sharing residence with someone randomized to a different arm (n=12); attending individual session only (n=4); and failure to attend any of the intervention sessions (n=21).
Mixed model analyses of continuous scale end points used the residual maximum likelihood method to cope with missing values. Significance of the F-test for the group by time interaction is reported as well as t tests for the within-group changes over time and the between-group differences at each time. The proportion of participants in each group known to have achieved each of the dietary and physical activity goals at T1 and T3 was calculated, and the method of generalized estimating equations was used to fit models to enable group by time interactions to be tested (Wald χ2 test). The body weight goal (≥5% reduction at 12 months) was assessed using a two-sample binomial test to compare the proportions in each group. The number of goals achieved by individuals at 12 months was assessed using a mixed model analysis. Sensitivity analyses, in which missing assessments were deemed to indicate unmet goals, were conducted for each goal and also for the combined score. Unless otherwise stated, statistical tests were conducted at the 5% significance level without adjustments for multiplicity of either end points or comparisons.
Participants
In total, 2616 individuals were screened for eligibility, with 1067 having AUSDRISK score ≥15. For various reasons, 725 people declined to participate. The ITT analysis set consisted of the remaining 342 participants—177 intervention and 165 control arm (see online supplementary file 2—CONSORT diagram). Major protocol deviations resulted in exclusion of further 44 participants. The PPS consisted of 298 participants—143 intervention and 155 control arm.
Ethics
Deakin University Human Research Ethics Committee granted approval—project code 2009-066. MDPS was registered with the Australian New Zealand Clinical Trial registry: ACTRN12609000507280.
Results
Control and intervention arms had similar characteristics at baseline (table 1). Overall mean age was 65 years with 38% men. At baseline, 290 (84.8%) participants in the ITT had a FPG ≤5.6 mmol/L and 52 (15.2%) participants had a FPG 5.7–6.9 mmol/L (impaired fasting glucose). Similarly 281 (82.4%) participants in the ITT had a 2 h OGTT glucose ≤7.8 mmol/L and n=60 (17.6%) had a 2 h OGTT glucose 7.9–11.0 mmol/L (impaired glucose tolerance).
Baseline characteristics of control participants, intervention participants, and all participants in the Melbourne Diabetes Prevention Study
Table 2 presents the main outcome measure results of the PPS and ITT data sets. PPS results were considered more informative for the reasons outlined in the discussion, hence only the PPS results are given here.
Two-way table of predicted means (SEM) of time and group using ITT and the PPS
At 12 months in the PPS, the intervention group mean weight loss was 0.84 kg but controls gained 0.29 kg (mean difference 1.13 kg; p=0.016). Similarly the intervention group mean waist circumference decreased by 0.90 cm but controls increased by 0.45 cm (mean difference 1.35 cm; p=0.044). This 0.96% weight reduction predicts a 9.6% diabetes risk reduction. The intervention group reduced systolic BP by 7.3 mm Hg and controls by 2.1 mm Hg (mean difference 5.2 mm Hg; p=0.028). A similar effect was seen in diastolic BP. The intervention group reduced diastolic BP by 4.9 mm Hg and controls by 1.7 mm Hg (mean difference 3.2 mm Hg; p=0.030). There were no significant time–arm interactions for FPG, OGTT 2 h glucose, total cholesterol, LDL-cholesterol, HDL-cholesterol, or triglycerides.
In the analysis of the PPS for patients without established CVD, average 5-year Framingham absolute CVD risk decreased in the intervention group from 9.72% to 8.75% (p=0.002, 10.4% relative risk reduction), and increased in controls from 8.35% to 8.46% (p=0.712, 1.3% relative risk increase) resulting in a net effect of −1.08% points of absolute risk. The interaction between time and study arm was statistically significant (p=0.013).
Using the PPS, the 3 month intensive intervention phase showed statistically significant reductions in weight, waist, systolic and diastolic BP, and Framingham 5-year absolute risk compared with baseline for intervention participants. There was also a statistically significant increase in HDL-cholesterol (see online supplementary file 3). Between 3 and 12 months, diastolic BP was reduced further and there were slight but non-significant increases in weight, systolic BP, and Framingham 5-year absolute risk. A significant increase of 1 cm in waist circumference occurred between 3 and 12 months.
In the PPS, the proportion of participants meeting the fiber intake goal increased from 20% (baseline) to 33% (12 months) in the intervention arm, but there was no change in the control arm (p=0.028). A greater percentage of participants in the intervention group than in the control group achieved the 5% weight reduction goal (15% vs 8%; p=0.026). The total number of goals achieved at the conclusion of the study in the intervention group was higher than in the control group (1.26 vs 0.94; p=0.003). A similar conclusion held when missing goal assessments were assumed to be unmet goals (table 3).
Proportions (%) of participants meeting the goals of the Life! programme at baseline and 12 months, and total number of goals achieved at 12 months for PPS and ITT
Conclusions
This is the first report of an evaluation for a scaled-up diabetes prevention programme using an RCT. The MDPS was an effectiveness trial linked to the statewide, translational diabetes prevention programme Life! in Victoria, Australia. In the PPS analysis after 12 months, MDPS showed significant improvements in weight, waist, BP, and CVD risk in the intervention group compared with usual care. Diabetes risk was also reduced. A statistically significant CVD risk reduction between baseline and 12 months was shown in the intervention group with no change in the control group. The intervention group CVD risk reduction resulted mainly from a considerable BP reduction, which was not explained by any single factor, such as weight loss, physical activity, or medication changes, between baseline and 12 months. The improvement in BP is likely to be multifactorial with exercise, weight loss, reduced salt intake, and medication all having contributory effects.
MDPS showed a smaller intervention effect compared with some other trials, possibly because lower baseline risk meant there was less scope for improvement in health measures.6 ,12 A similar effect was seen in FIN D2D which was a real-world scaled-up programme run in Finnish primary healthcare.9 However, even a modest 1 kg weight reduction can reduce diabetes risk by 16%.32
Life! is the second scaled-up diabetes prevention programme to be reported, after the FIN D2D programme. Several randomized efficacy trials demonstrated that lifestyle modification interventions are effective in reducing T2DM risk.2–4 Many translational ‘real-world’ diabetes prevention programmes have also demonstrated positive results, but they were all small scale.6 Once high-risk individuals attend the interventions, and especially if the intervention dose is large enough, they benefit remarkably from lifestyle modification.6 Furthermore, participants from all socioeconomic groups seem to benefit equally.34 What has been missing is the rigor of an RCT, in real-world, scaled-up settings to measure impact.
Public health interventions and ITT analysis
Although some would see ITT as the gold standard for reporting real-world diabetes prevention programmes, not all studies included in the recent systematic review reported ITT.6 In MDPS, a single intervention participant who gained 20 kg contributed to the non-significant effect in the ITT analysis. If he was excluded from analysis, weight reduction changes from p=0.079 to 0.026. The PPS analysis excluded this participant (prior to statistician unblinding) because he did not attend any intervention sessions. The PPS analysis relates to an idealized situation and demonstrates what the benefits can be for willing participants. Health services planning is based on those who are prepared to participate in an intervention. By presenting both ITT and PPS data, we aim to show a fuller picture.
Programme drift
A major concern about real-world diabetes prevention programmes is the extent of benefit delivered over extended time periods, particularly important given the long-term payback on investment. Programme drift denotes deviation from protocol resulting in a reduced effect, and it is potentially an important cause of attenuated effect.17
In common with diabetes prevention programmes generally, recruiting difficulties for MDPS were a challenge from the outset.35 Most participants were recruited during a brief contact in pharmacies and followed up by the study nurses. The recorded reasons for not proceeding to baseline testing were: no longer being interested, meeting exclusion criteria, AUSDRISK being below threshold on checking, living too far from the intervention, or becoming ill. After baseline testing, MDPS attrition rate was low mainly because the same nurse was involved in all participant contacts through to the final testing, multiple contact methods were used and the nurses were persistent. Similarly, recruitment into Life! was initially challenging and led to ongoing modifications of the programme to respond to that challenge.10 This raises issues about motivating high-risk individuals to participate in such programmes, in order for the programmes to improve their effect, and ensure their future sustainability. Another example of programme drift in MDPS (and Life!) was that intervention participant weight and waist circumference did not continue to reduce between 3 and 12 months (see online supplementary file 3), unlike in the original GGT DPP.9 The MDPS intervention dose was lower in terms of number of sessions included and time allocated to self-monitoring tools feedback, for example, food and physical activity diaries.12 This reduction potentially decreased the level of social support and intervention intensity experienced by participants.36 Providing individualized risk feedback is important and more likely to result in behavior change than generalized feedback.37 A recent systematic review described the importance of intervention intensity and fidelity for achieving positive outcomes.6
Voltage drop
Voltage drop denotes the reduced benefits of diabetes prevention programmes when they move from efficacy trials to the real world. Voltage drop in MDPS (and Life!) might largely be explained by participant screening using AUSDRISK. MDPS baseline weight, waist, lipids, and glucose measures were all noticeably lower than in GGT DPP,12 and MDPS participants were 10 years older. Relatively low baseline diabetes risk might also explain the absence of changes in glucose measures. Participants at low risk would have become aware of this fact during their first session, which may have reduced their motivation for lifestyle modification. Mean AUSDRISK score for MDPS participants was 18.5 corresponding to a risk of one in seven developing T2DM. In our earlier GGT DPP, mean FINDRISC score of participants was 15.7 corresponding to a higher risk of one in three.12 These results raise the question about which entry score to use for identifying high-risk individuals for admission into interventions. We note in our cohort that BP and cholesterol were lower than the GGT DPP12 and Finnish DPS4 at baseline. This is the first report comparing AUSDRISK’s performance in a lifestyle modification intervention trial. AUSDRISK entry score was established by the Council of Australian Governments for use by all state and federally funded programmes, including the Life! programme, with a score ≥15 indicating high risk of developing diabetes (1 in 7 risk). Subsequently eligibility for Life! changed to a score ≥12 which is equal to a 1 in 14 risk of developing diabetes. High BMI is a significant predictor of T2DM, but BMI is not included in AUSDRISK. FINDRISC includes both BMI and waist circumference. Furthermore, as AUSDRISK is heavily loaded for age, male gender, and other non-modifiable risk factors, even AUSDRISK score ≥20 can still result in participants entering programmes with only non-modifiable risk factors detected.
Screening into diabetes prevention programmes in the real world usually includes a glucose metabolism indicator as an entry criterion.6 FPG has been shown to strongly improve the performance of risk prediction models based on non-invasive measures (routinely collected data or questionnaire data).38 Based on this evidence and our findings, we recommend that a glucose metabolism measure be used in conjunction with a diabetes risk score when screening for high-risk individuals to enter into diabetes prevention programmes. The obligatory use of AUSDRISK is an example of voltage drop caused by real world, an unintended adverse consequence of government policy.
Consequently, there are lessons about hazards of developing new risk assessment tools rather than using the internationally well-established FINDRISC.39 In the only other reported scaled-up diabetes prevention programme, FIN D2D, the entry criterion was set at a FINDRISC score ≥159 which is equivalent to 20 on the AUSDRISK. Rather than overwhelm health services, the Finnish government decided to only take those at highest risk, as approximately 30% of the population aged 50 years or over is at moderate-to-high risk of developing T2DM.40 The current AUSDRISK score for entry into diabetes prevention programmes needs to be revised.
Strengths, limitations and implications
Using an RCT with well-matched intervention and control groups, we critically investigated a real-world, scaled-up implementation of a diabetes prevention programme in order to learn more about effectiveness. We have provided recommendations on how the Life! programme can be improved. The main difficulty of the MDPS appears to relate to recruitment being considerably less than originally intended. Potential participants were more willing to be recruited to the Life! programme or be recommended to the Life! programme by their GPs than to take the perceived risk of being in the control group of the RCT. Additionally, the MDPS participants were older, with a higher proportion retired, and having smaller waist circumferences than those in Life!, limiting the effect the intervention might have.
Challenges during the enrolment phase and funding constraints resulted in the recruitment of 342 participants (177 intervention and 165 control) out of an initial target of 796 (398 per arm). With the reduced numbers, the trial was still powered to detect small-to-moderate effect sizes for diastolic BP, 2 h OGTT, total cholesterol, LDL, weight, and waist circumference. At this sample size, the trial was underpowered to detect differences in FPG, triglycerides, systolic BP, and diastolic BP—noting that the two BP measures were significant when testing the group by time interaction.
This study's strength was the rigorous methodology for MDPS data collection compared with the data collected in Life! For example, MDPS weight and waist circumference were performed by study nurses who used strict protocols. In Life! facilitators perform the measures with no external verification of data accuracy. These strengths and limitations may explain much of the difference in effect size between MDPS and Life!10
Building a sustainable health promotion programme requires long-term financing, workforce training, supervision, and organizational support. The benefits of engaging in ongoing development, evaluation, and refinement of programmes should show as increased effects, improved quality, or both.17 Based on this study, the Life! programme could apply quality improvement strategies to the intervention to achieve better impact and sustainability.
This study highlights the need to identify and recruit participants more likely to benefit from lifestyle modification programmes. When scaling-up diabetes prevention programmes in the real world, maintaining fidelity to the original components is an essential requirement, along with the need for ongoing accurate data collection to facilitate quality improvement aimed at enhancing sustainability and effect.
Acknowledgments
The authors would like to acknowledge the Victorian Government Department of Health Victoria who funded the Life! Taking action on diabetes programme and Professor Greg Johnson and Dr Amy Timoshanko at Diabetes Australia Victoria for implementing Life!, as well as MDPS project team members: Trish Clark, Dino Asproloupos, Jessica Bucholc, Jacinta Sharpe, Caddie Conroy, Carol Wildey, Jessica Webster, Denise van den Bosch, Vicky Cogley, Clare D'Onofrio, Anne Bruce, Candy De Souza, Andrew Dalton, Lisa Mighall, Maya Rivis, Kate Delley, Thili Chengodu, Annette Bond, Chris Schouler, Jieling Li, Greater Eastern Primary Health, Sarah Bowman, Ben Philpot, Vicki Brown, Dr Nathalie Davis, Natasha Sciotto, and Su Neuling.
References
Supplementary materials
Supplementary Data
This web only file has been produced by the BMJ Publishing Group from an electronic file supplied by the author(s) and has not been edited for content.
- Data supplement 1 - Online supplement
- Data supplement 2 - Online supplement
- Data supplement 3 - Online supplement
Footnotes
Contributors JAD, EDJ, and RC were responsible for the research question, design of the study, and for obtaining funding. JAD, ALH, VLV, EV, and TL wrote the first draft of this manuscript. ALH and VLV were responsible for the revisions, along with EDJ and JDB. JR, VLV, and MC undertook the data analysis. JDB, TCS, SLO, KPM, ES, and CMB contributed to specific sections of the manuscript. All authors read and approved the final version of the manuscript.
Funding This study was funded by the National Health and Medical Research Council, grant number: 533819.
Competing interests None declared.
Patient consent Obtained.
Ethics approval Human Ethics Unit Research Integrity Office, Research Services Division, Deakin University CRICOS Provider Code 00113B (Vic).
Provenance and peer review Not commissioned; externally peer reviewed.
Data sharing statement No additional data are available.